Record rainfall was reported for many areas this past week. For example, the Dayton area recorded 6.74 inches between May 18-24, the most rain to occur during a single week in May on record (1893 – 2026). All but northwest Ohio received more 2 inches, with much of central and southern Ohio picking up 3-6 inches over the stretch. Rainfall totals for the last 30 days are significant (Figure 1), ranging from 2-3 inches in far northwest Ohio (a bit below average) to over 10 inches in southwest Ohio (200-300% of normal). The latest U.S. Drought Monitor shows an expansion of D1 drought conditions last week to about 5% of the state across southern Ohio counties. However, with the recent rainfall, improvements are likely with the new USDM release on Thursday May 28, 2026. For more monthly and quarterly updates, please visit the State Climate Office of Ohio or sign up for email updates at https://go.osu.edu/oh-climate-summaries.

Soils
The latest observations from the Ohio Mesonet show that two-inch daily-average soil temperatures range from 66-73°F (Figure 2), with maxium daytime temperatures reaching the low to mid 80s. Soil moisture has risen significantly in response to the saturated conditions, with field capacity conditions (>~30%) at all sites. Several locations including Fremont, Columbus, and Belle Valley show 2 two-inch soil moisture values above 50% by volume.

Outlook
Additional rounds of showers and storms are possible on Tuesday night through the day on Wednesday (May 27). Dry weather will take control for Thursday through early next week. Highs will mostly top out in the 70s with overnight lows in the 50s and 60s throughout the period. The current National Weather Service precipitation forecast shows precipitation totals between 0.1-1.25 inches across central and southern Ohio with lighter amounts farther north over the next 7 days (Figure 3).
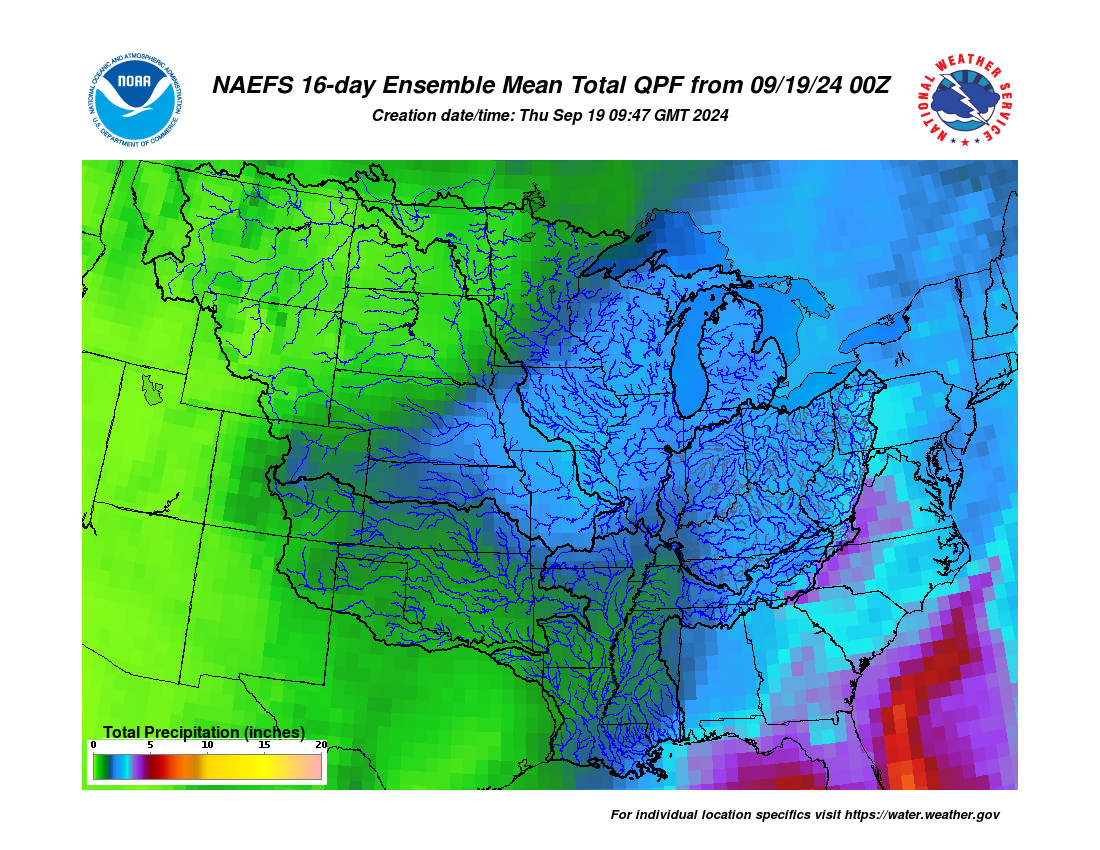
 The 6-14 day outlook from the Climate Prediction Center for the period of May 31 – June 4, 2026 and the 16-Day Rainfall Outlook from NOAA/NWS/Ohio River Forecast Center show probabilities of cooler and drier than normal conditions (Figure 4). Climatology for this period indicates a normal high-temperature range of 72-77°F, a low-temperature range of 51-56°F, and weekly total precipitation of 0.85 – 1.15 inch.